
Watchlist
Muestra los datos más relevantes para analizar instrumentos. Se visualizan diferentes vistas:
• Tabla • Quotes • Quotes con gráfica • Histograma • gráficas.
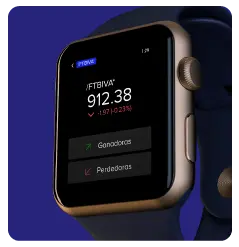
Ganadoras y perdedoras
Mostrando las emisoras, indicando su porcentaje de cambio y su ganancia o pérdida por día.
Gráfica simple
Cuenta con la funcionalidad de mostrar una gráfica informativa de área o en líneas, intradía o interdía, acompañada de cambios de porcentaje, fecha y cambio neto.
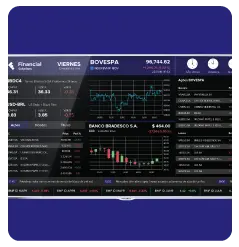
Gráfica avanzada
Este widget tiene la finalidad de mostrar una gráfica avanzada del mercado, indicadores técnicos, temporalidad, calendario; agregando gráficas de :
• Área • Línea • Barra • Velas
Tickers
También es conocido como banda corrida, y muestra información de instrumentos como cambio de porcentaje, cambio neto y cambio de precio.
Tabla
Tiene la funcionalidad de mostrar emisoras indicando su porcentaje de cambio y su ganancia o pérdida del día.
Mercado cruzado de divisas
Con los datos más relevantes para analizar instrumentos. Se visualizan diferentes vistas: Tabla Quotess, Quotes con gráfica, Histograma gráficas
Screener
Se encarga del filtrado de valores fundamentales o de precio del día, para mostrar como resultado datos personalizados para los usuarios.
Portafolio
Muestra un portafolio personalizable de las acciones del usuario, las cuales se podrán dar de alta dentro del portafolio, para así tener un seguimiento diario y preciso de su rendimiento.
Notificaciones
Programa y personaliza las alertas de notificaciones de precios, cambios netos y cambios % para las emisoras que se desee. Recibe las notificaciones por correo, SMS, y/o en el portal.
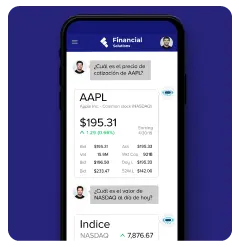
Noticias
Estos widgets muestran el top de noticias de REFINITIV de una manera visual, resaltando la noticia principal acompañado de un carrusel de otros temas.
Recomendación de analistas
Este módulo muestra la recomendación del equipo de analistas de Refinitiv, de una manera periódica iniciando con la actual, la de hace una semana, un mes, dos meses, tres meses atrás con una calificación estandarizada, siendo el 1 el mejor y el 5 el peor.
Mapamundi
Este módulo muestra la información más relevante de los índices a nivel mundial, resaltando con color rojo los países con pérdida y con verde aquellos que han sido cerradas positivamente.