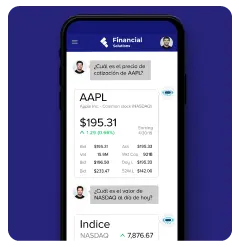

Search Engine
In the search engine you will be able to write the name or ticker symbol of the instrument you wish to consult to display the information available for said asset.
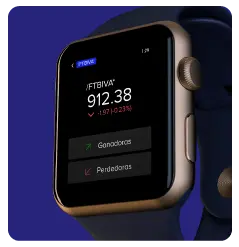
Winners and Losers
This module has the functionality of showing stations indicating their percentage of change and their profit or loss per day.
Simple Graph
This widget has the functionality of displaying an informative intraday or interday graph by area or in lines, accompanied by percentage changes, date and net change.
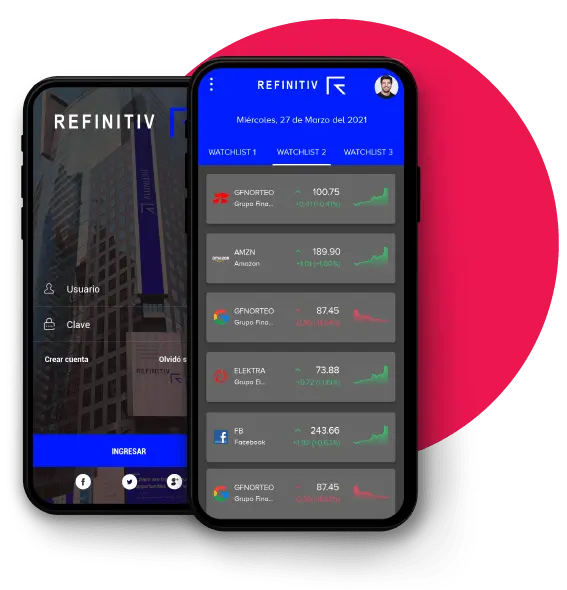
Table
This module has the functionality of showing stations indicating their percentage of change and their profit or loss per day.
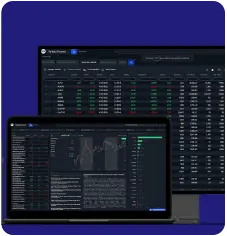
Advance Table
This widget is in charge of filtering the fundamental values or prices of the day, to show custom data as a result.
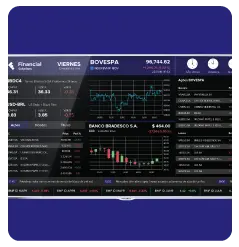
Tickers
This module is also known as the running band, it shows information about instruments such as percentage change, net change and price change.
Advance Graph
This widget has the functionality of displaying an advanced graph of the market, technical indicators, timing, calendar by adding graphs of:
• Area • Line • Bar • Candles